# start socket only not cockpit.service sudo systemctl enable --now cockpit.socket systemctl status cockpit.socket # see port opened: 9090 sudo ss -tnlp
# still inactive systemctl status cockpit.service
Set root password, user vagrant is privileged, run:
1
sudo passwd root
I have the port forwarding for 9090, view cockpit UI by localhost:9090, login as root user with the password you set. After login the cockpit.service is now active:
1
systemctl status cockpit.service
There is a terminal in web UI, you can work with it just like working on a normal ssh terminal.
The dashboard plugin:
1 2 3 4 5 6
# see plugins # you can see yum packages installed and available yum list cockpit*
yum info cockpit-dashboard yum install -y cockpit-dashboard
With cockpit dashboard plugin installed, you can connect to remote machine (with cockpit installed and cockpit.socket running), dashboard is just like a control plane.
Other plugins like cockpit-machines is used to manage virtual guests.
Enhancing Firewall
RedHat 8 Getting start with nftables
It is the designated successor to the iptables, ip6tables, arptables, and ebtables tools. Stick to one command, not using mixed. firewalld command can be replaced by nftables.
NFTables nft is the default kernel firewall in CentOS 8. Single command for IPV4, IPV6 ARP, and Bridge filters. nftables does not have any predefined tables, tables are created by firewalld or rely on our scripts.
First yum install nftables, run as sudo or root.
1 2 3 4
systemctl disable --now firewalld reboot # list all tables, nothing is there. nft list tables
Now start and enable firewalld, the tables will be created:
1 2 3 4 5 6 7 8 9 10 11 12 13 14 15 16 17 18 19
systemctl enable --now firewalld # list all tables nft list tables
table ip filter table ip6 filter table bridge filter table ip security table ip raw table ip mangle table ip nat table ip6 security table ip6 raw table ip6 mangle table ip6 nat table bridge nat table inet firewalld table ip firewalld table ip6 firewalld
Some common commands:
1 2 3 4 5 6 7
# list all tables nft list tables
# list tables with specific protocol family nft list tables ip # check detail of ip filter nft list table ip filter
Let’s see the demo code to build nftables:
create chains
create rules
1 2 3 4 5 6 7 8 9 10 11 12 13 14
# disable firewalld systemctl disable --now firewalld ; reboot nft list tables # inet will work both for ipv4 and ipv6 # create a new table `filter` nft add table inet filter
# INPUT is the chain name, not necessarily call it INPUT # here we add INPUT chain to inet filter table nft add chain inet filter INPUT \ # basic chain type: filter, route, nat # basic hook types: prerouting, input, forward, output, postrouting, ingress # priority 0 ~ 100, 0 is hightest { type filter hook input priority 0 \; policy accept \;}
Add SSH inbound to our system, set rules:
1 2 3 4 5 6 7 8
# add rule to inet filter table INPUT chain nft add rule inet filter INPUT iif lo accept # allow traffic back to system with specified state nft add rule inet filter INPUT ct state \ established,related accept nft add rule inet filter INPUT tcp dport 22 accept # drop everthing that is not explicitly defined nft add rule inet filter INPUT counter drop
# the systemd service unit for nftables use /etc/sysconfig/nftables.conf nft list ruleset > /etc/sysconfig/nftables.conf nft flush table inet filter nft delete table inet filter systemctl enable --now nftables
NFSv4
CentOS 8 uses NFSv4.2 as NFS server.
The new tool nfsconf writes to the /etc/nfs.conf.
Enable and use NFSv4 only and managing inbound TCP connections using firewall.
SELinux NFS configuration.
Install nfs package for both server and clients:
1
yum install -y nfs-utils
The default will have NFSv2 disable and NFSv3 and above enabled, we will disable NFSv3 and have NFSv4 only with TCP port 2049 to be opened. 这样看来之前项目中的NFS 用的默认设置,并且不是secure的.
we can edit /etc/nfs.conf or using nfsconf commands:
1 2 3 4 5
nfsconf --set nfsd vers4 y nfsconf --set nfsd tcp y # close udp and nfsv3 nfsconf --set nfsd vers3 n nfsconf --set nfsd udp n
mkdir /share # copy *.txt under /usr/share/doc to /share # {} represents the content find finds # \; is used for find command, escape in bash find /usr/share/doc -name '*.txt' -execcp {} /share \;
Go to edit /etc/exports file
1 2 3 4 5 6 7 8 9 10
# Here only rw, in my previous work, we use (rw,insecure,async,no_root_squash) # 这里其他默认设置够用了 /share *(rw)
Example Use Case:
To reduce the amount of operational and storage costs in data centers, we use the deduplication and compression features in VDO to decrease the footprint of data.
Cassandra quick started with
single docker node. You can extend it to test any Cassandra client, for example
gocql, build the app with golang image and bring it up in the same docker
network.
Cassandra basics to
understand consepts such as ring(cassandra cluster, masterless), horizontal
scaling(aka scale-out), partitioning, RF(replication factor), CL(consistency
level), quorum(RF/2+1), CAP(cassandar by default AP).
Keyspace: a namespace that defines data replication on nodes, one keyspace may
have mutliple related tables, the Replicatin Strategy is keyspace-wide:
simply strategy for single data center
network topology strategy for multiple data centers
Data center can have multiple racks.
For example, one data center has 2 racks, rack1 has 2 nodes, rack2 has one node,
if the simply strategy is 1, then rack1 owns 50% data, each node in rack1 owns
25%, rack2 owns 50%, since rack2 only contains 1 node, so that node owns 50%.
Tunable Consistency
Coordinator Node: client connect to perform actions. Each connection to
Cassandra may have a different coordinator node, any node can be the coordinator.
You can configure consistency on a cluster, datacenter, or per individual read
or write operation. see this doc for
details.
Consistency level for write:
ONE, TWO, THREE
QUORUM(majority of nodes succeeds)
ALL(must all good)
ANY(include coordinator itself).
Hinted Handoff: when one write node is unavaiable, the data is written to
coordinator node, the coordinator node will try repeatedly write to the
unavailable node until succeeded.
Consistency level for read: how many nodes to consult to return the most
current data to caller.
Read Repair: 当对一个node写失败了but back online later,在read时如果有多个replicas
的数据可以参考,则对那个node可重新写入上次wirte失败的数据. Run nodetool repair
periodically will resolve the inconsistencies in cluster.
LOCAL_QUORUM: local means current coordinator node data center
LOCAL_ONE: the same as ONE
Partition, Composite and Clustering Key
To correctly run cql, especially the order by, you need to understand how to
define primary key and use partition, composite and clustering
keys efficiently:
With cqlsh script, you can specify remote Cassandra node with port to connect,
by default it will connect to localhost 9042 port.
Keyspace -> Tables -> partitions -> row.
In brief, each table requires a unique primary key. The first field listed is
the partition key, since its hashed value is used to determine the node to
store the data. If those fields are wrapped in parentheses then the partition
key is composite. Otherwise the first field is the partition key. Any fields
listed after the primary key are called clustering columns. These store data
in ascending or descending order within the partition for the fast retrieval of
similar values. All the fields together are the primary key.
Documented shell commands: =========================== CAPTURE CLS COPY DESCRIBE EXPAND LOGIN SERIAL SOURCE UNICODE CLEAR CONSISTENCY DESC EXIT HELP PAGING SHOW TRACING
## specified cqlsh> help consistency;
CQL help topics: ================ AGGREGATES CREATE_KEYSPACE DROP_TRIGGER TEXT ALTER_KEYSPACE CREATE_MATERIALIZED_VIEW DROP_TYPE TIME ALTER_MATERIALIZED_VIEW CREATE_ROLE DROP_USER TIMESTAMP ALTER_TABLE CREATE_TABLE FUNCTIONS TRUNCATE ALTER_TYPE CREATE_TRIGGER GRANT TYPES ALTER_USER CREATE_TYPE INSERT UPDATE APPLY CREATE_USER INSERT_JSON USE ASCII DATE INT UUID BATCH DELETE JSON BEGIN DROP_AGGREGATE KEYWORDS BLOB DROP_COLUMNFAMILY LIST_PERMISSIONS BOOLEAN DROP_FUNCTION LIST_ROLES COUNTER DROP_INDEX LIST_USERS CREATE_AGGREGATE DROP_KEYSPACE PERMISSIONS CREATE_COLUMNFAMILY DROP_MATERIALIZED_VIEW REVOKE CREATE_FUNCTION DROP_ROLE SELECT DROP_TABLE SELECT_JSON
Create a keyspace with:
1
create keyspace pluralsight with replication = {'class':'SimpleStrategy', 'replication_factor':1};
Create a table in this keyspace with:
1 2
use pluralsight; create table courses (id varcharprimary key);
Optionally attempt to create the table again with:
1
create table if notexists courses (id varcharprimary key);
(and note that you will not get an error as long as the ‘if not exists’ is present)
Add a few columns to the courses table with:
1 2 3
alter table courses add duration int; alter table courses add released timestamp; alter table courses add author varchar;
Add a comment to the table with:
1
alter table courses with comment ='A table of courses';
View the complete table and all its default properties with:
1 2
-- describe desctable courses;
Drop and recreate a more complete courses table with:
1 2 3 4 5 6 7 8 9 10 11
droptable courses;
create table courses ( id varcharprimary key, name varchar, author varchar, audience int, duration int, cc boolean, released timestamp ) with comment ='A table of courses';
(Note that when entering the lines as above cqlsh will automatically detect a
multi-line CQL statement)
Exit cqlsh:
1
exit
Load course data by running a series of CQL commands from an external file
1
cat courses.cql | cqlsh
Verify that the CQL commands in the file were indeed executed:
1 2 3
use pluralsight; desc tables; select*from courses;
(The ‘desc tables’ should show a single ‘courses’ table, and the ‘select’
statement should show 5 rows of sample data.)
The ‘expand’ cqlsh command will display the query results in a ‘one column per
line’ format:
1 2 3 4
-- pretty format expand on; select*from courses; expand off;
You can display the time a piece of data was written with the ‘writetime’
function:
1
select id, cc, writetime(cc) from courses where id ='advanced-javascript';
We can update this cc column with an ‘update’ statement:
1
update courses set cc =truewhere id ='advanced-javascript';
Now re-run the select statement containing the ‘writetime’ function and notice
that the time has changed. You can prove to yourself that this write time is
stored on a per column basis by selecting this for a different column:
1
select id, name, writetime(name) from courses where id ='advanced-javascript';
Note that this writetime value is the same as the one returned by our first ‘cc’ query.
Cassandra also provides a function for returning the token associated with a
partition key:
1
select id, token(id) from courses;
If you try to select from a column other than the primary key, you’ll get an
error:
1
select*from courses where author ='Cory House';
(We’ll show how to do this in a later module.)
Let’s create a users table:
1 2 3 4 5 6 7
create table users ( id varcharprimary key, first_name varchar, last_name varchar, email varchar, password varchar ) with comment ='A table of users';
Then we’ll insert and “upsert” two rows of data:
1 2 3
insert into users (id, first_name, last_name) values ('john-doe', 'John', 'Doe'); update users set first_name ='Jane', last_name ='Doe'where id ='jane-doe'; select*from users;
(Note that the net effect of the insert and update are the same.)
Now we’ll add a new ‘reset_token’ column to this table, and add a value to this
column with a TTL:
1 2
alter table users add reset_token varchar; update users using ttl 120set reset_token ='abc123'where id ='john-doe';
We can retrieve the time remaining for a ttl with the ‘ttl’ query function:
1
select ttl(reset_token) from users where id ='john-doe';
We can turn on tracing and do a select to see that there are currently no
tombstones:
1 2
tracing on; select*from users where id ='john-doe';
(Re-run this several times until the 2 minutes have elasped and the token_value
will be gone, and tracing will show a tombstone.)
Turn off tracing:
1
tracing off;
Create a ratings table with two counter columns:
1 2 3 4 5
create table ratings ( course_id varcharprimary key, ratings_count counter, ratings_total counter ) with comment ='A table of course ratings';
Now let’s increment both counter columns to represent receiving a new course
rating of 4:
insert into ratings (course_id, user_id, rating) values ('cassandra-developers', 'user1', 4); insert into ratings (course_id, user_id, rating) values ('cassandra-developers', 'user2', 5); insert into ratings (course_id, user_id, rating) values ('cassandra-developers', 'user3', 4); insert into ratings (course_id, user_Id, rating) values ('advanced-python', 'user1', 5);
You can select the average for a single course (across users):
1 2
select course_id, avg(rating) from ratings where course_id ='cassandra-developers'; select course_id, avg(rating) from ratings where course_id ='advanced-python';
However, you can’t apply aggregate functions across partition keys:
1
select course_id, avg(rating) from ratings; -- incorrect results
Multi-Row Partition
Composite Key
Previously we only have one primary key in table, that primary is the partition
key. But it could be:
Drop this table and create a new one to hold both course and module data
1 2 3 4 5 6 7 8 9 10 11 12 13 14
droptable courses; create table courses ( id varchar, name varchar, author varchar, audience int, duration int, cc boolean, released timestamp, module_id int, module_name varchar, module_duration int, primary key (id, module_id) ) with comment ='A table of courses and modules';
Insert data for the course, plus the first two modules
1 2 3 4 5
insert into courses (id, name, author, audience, duration, cc, released, module_id, module_name, module_duration) values ('nodejs-big-picture','Node.js: The Big Picture','Paul O''Fallon', 1, 3240, true, '2019-06-03',1,'Course Overview',70);
insert into courses (id, name, author, audience, duration, cc, released, module_id, module_name, module_duration) values ('nodejs-big-picture','Node.js: The Big Picture','Paul O''Fallon', 1, 3240, true, '2019-06-03',2,'Considering Node.js',900);
Select the data we just inserted
1 2 3
-- get same result select*from courses; select*from courses where id ='nodejs-big-picture';
Now we can include both id and module_id in our where clause
1
select*from courses where id ='nodejs-big-picture'and module_id =2;
We can’t select by just module, unless we enable ‘ALLOW FILTERING’
1 2 3
-- if no partition_key, performance downgrade select*from courses where module_id =2; // fails select*from courses where module_id =2 allow filtering; //succeeds
Now insert the remaining modules for the course
1 2 3 4 5 6 7 8
insert into courses (id, name, author, audience, duration, cc, released, module_id, module_name, module_duration) values ('nodejs-big-picture','Node.js: The Big Picture','Paul O''Fallon', 1, 3240, true, '2019-06-03', 3, 'Thinking Asynchronously', 1304);
insert into courses (id, name, author, audience, duration, cc, released, module_id, module_name, module_duration) values ('nodejs-big-picture','Node.js: The Big Picture','Paul O''Fallon', 1, 3240, true, '2019-06-03', 4, 'Defining an Application and Managing Dependencies', 525);
insert into courses (id, name, author, audience, duration, cc, released, module_id, module_name, module_duration) values ('nodejs-big-picture','Node.js: The Big Picture','Paul O''Fallon', 1, 3240, true, '2019-06-03', 5, 'Assembling a Development Toolset', 489);
We can also use module_id as part of an “in” clause
1
select*from courses where id ='nodejs-big-picture'and module_id in (2,3,4);
And we can order by module_id
1
select*from courses where id ='nodejs-big-picture'orderby module_id desc;
We can “select distinct” just the id, but not the id and course name:
1 2
selectdistinct id from courses; //succeeds selectdistinct id, name from courses; // fails
Static Columns
Static Columns are static within the partition.
Its the common data in a partition.
From cqlsh, drop and recreate the courses table, using static columns
1 2 3 4 5 6 7 8 9 10 11 12 13 14 15
use pluralsight; droptable courses; create table courses ( id varchar, name varcharstatic, author varcharstatic, audience intstatic, duration intstatic, cc booleanstatic, released timestampstatic, module_id int, module_name varchar, module_duration int, primary key (id, module_id) ) with comment ='A table of courses and modules';
Insert just the course data, and select it back
1 2 3 4
insert into courses (id, name, author, audience, duration, cc, released) values ('nodejs-big-picture','Node.js: The Big Picture','Paul O''Fallon', 1, 3240, true, '2019-06-03');
select*from courses where id ='nodejs-big-picture';
Now insert the module data for the first two modules
1 2 3 4 5
insert into courses (id, module_id, module_name, module_duration) values ('nodejs-big-picture',1,'Course Overview',70);
insert into courses (id, module_id, module_name, module_duration) values ('nodejs-big-picture',2,'Considering Node.js',900);
Selecting from courses now returns both course and module data in each row
1 2
select*from courses where id ='nodejs-big-picture'; select*from courses where id ='nodejs-big-picture'and module_id =2;
Insert the third module, but also change the name of the course. Select all rows to show the course title changed everywhere.
1 2 3 4
insert into courses (id, name, module_id, module_name, module_duration) values ('nodejs-big-picture', 'The Big Node.js Picture', 3, 'Thinking Asynchronously', 1304);
select*from courses where id ='nodejs-big-picture';
Insert the fourth module, and fix the course name
1 2
insert into courses (id, name, module_id, module_name, module_duration) values ('nodejs-big-picture', 'Node.js: The Big Picture', 4, 'Defining an Application and Managing Dependencies', 525);
Insert the remaining course module
1 2
insert into courses (id, module_id, module_name, module_duration) values ('nodejs-big-picture', 5, 'Assembling a Development Toolset', 489);
The ‘in’ and ‘order by’ clauses work the same as before
1 2 3
select*from courses where id ='nodejs-big-picture'and module_id in (2,3,4);
select*from courses where id ='nodejs-big-picture'orderby module_id desc;
Select course info, repeated based on the number of modules in the course
1
select id, name, author, audience, duration, cc, released from courses;
Now “select distinct” course info and only get one row back
1
selectdistinct id, name, author, audience, duration, cc, released from courses;
Select just the module information for the course
1
select module_id, module_name, module_duration from courses where id ='nodejs-big-picture';
Load module-level course data by running a series of CQL commands from an
external file
1
cat data/courses2.cql | cqlsh
Select module information for the ‘advanced-javascript’ course
1 2
use pluralsight; select module_id, module_name, module_duration from courses where id ='advanced-javascript';
Select module information for the ‘docker-fundamentals’ course
1
select module_id, module_name, module_duration from courses where id ='advanced-python';
Select just the course-level information for all 5 courses
1
selectdistinct id, name, author from courses;
Time Series Data
Launch our one Cassandra node and (when it’s ready) load our sample course data
1
cat data/courses2.cql | cqlsh
From cqlsh, create a new table to hold course page views
1 2 3 4 5 6
use pluralsight; create table course_page_views ( course_id varchar, view_id timeuuid, primary key (course_id, view_id) ) with clustering orderby (view_id desc);
Insert a row into this table, using “now()” to create a timeuuid with the current date/time. Include a one year TTL.
1 2
insert into course_page_views (course_id, view_id) values ('nodejs-big-picture', now()) using TTL 31536000;
Insert another row into the table with a manually generated v1 UUID (also with a TTL)
1 2
insert into course_page_views (course_id, view_id) values ('nodejs-big-picture', bb9807aa-fb68-11e9-8f0b-362b9e155667) using TTL 31536000;
Insert two more rows using “now()”
1 2 3 4 5
insert into course_page_views (course_id, view_id) values ('nodejs-big-picture', now()) using TTL 31536000;
insert into course_page_views (course_id, view_id) values ('nodejs-big-picture', now()) using TTL 31536000;
Select the rows, and then use dateOf() to extract the date/time portion of the view_id
1 2
select*from course_page_views; select dateOf(view_id) from course_page_views where course_id ='nodejs-big-picture';
Reverse the date order of the results
1
select dateOf(view_id) from course_page_views where course_id ='nodejs-big-picture'orderby view_id asc;
Select only those dates based on Timeuuids that span a 2 day range
1 2 3 4 5
select dateOf(view_id) from course_page_views where course_id ='nodejs-big-picture' and view_id >= maxTimeuuid('2019-10-30 00:00+0000') and view_id < minTimeuuid('2019-11-02 00:00+0000');
-- adjust these dates as necessary to match a more current date range
Truncate the table, and add a static column
1 2
truncate course_page_views; alter table course_page_views add last_view_id timeuuid static;
Now insert three rows, using “now()” for both Timeuuids (with TTLs)
1 2 3 4 5 6 7 8
insert into course_page_views (course_id, last_view_id, view_id) values ('nodejs-big-picture', now(), now()) using TTL 31536000;
insert into course_page_views (course_id, last_view_id, view_id) values ('nodejs-big-picture', now(), now()) using TTL 31536000;
insert into course_page_views (course_id, last_view_id, view_id) values ('nodejs-big-picture', now(), now()) using TTL 31536000;
Selecting all rows shows different view_ids but the same last_view_id for all rows
1
select*from course_page_views;
Use ‘select distinct’ to get just the latest page view for this course
1
selectdistinct course_id, last_view_id from course_page_views;
For just one course, this can also be accomplished with the view_id and a LIMIT clause
1
select course_id, view_id from course_page_views where course_id ='nodejs-big-picture' limit 1;
However, a ‘limit’ won’t work across multiple courses. Insert multiple views for another course.
1 2 3 4 5 6 7 8
insert into course_page_views (course_id, last_view_id, view_id) values ('advanced-javascript', now(), now()) using TTL 31536000;
insert into course_page_views (course_id, last_view_id, view_id) values ('advanced-javascript', now(), now()) using TTL 31536000;
insert into course_page_views (course_id, last_view_id, view_id) values ('advanced-javascript', now(), now()) using TTL 31536000;
Select latest view_id from each course, using the limit clause
1 2
select course_id, view_id from course_page_views where course_id ='nodejs-big-picture' limit 1; select course_id, view_id from course_page_views where course_id ='advanced-javascript' limit 1;
Retrieve the latest course page view for all courses with ‘select distinct’ and the static column
1
selectdistinct course_id, last_view_id from course_page_views;
Select all the individual views for each course, one at a time
1 2
select course_id, view_id from course_page_views where course_id ='nodejs-big-picture'; select course_id, view_id from course_page_views where course_id ='advanced-javascript';
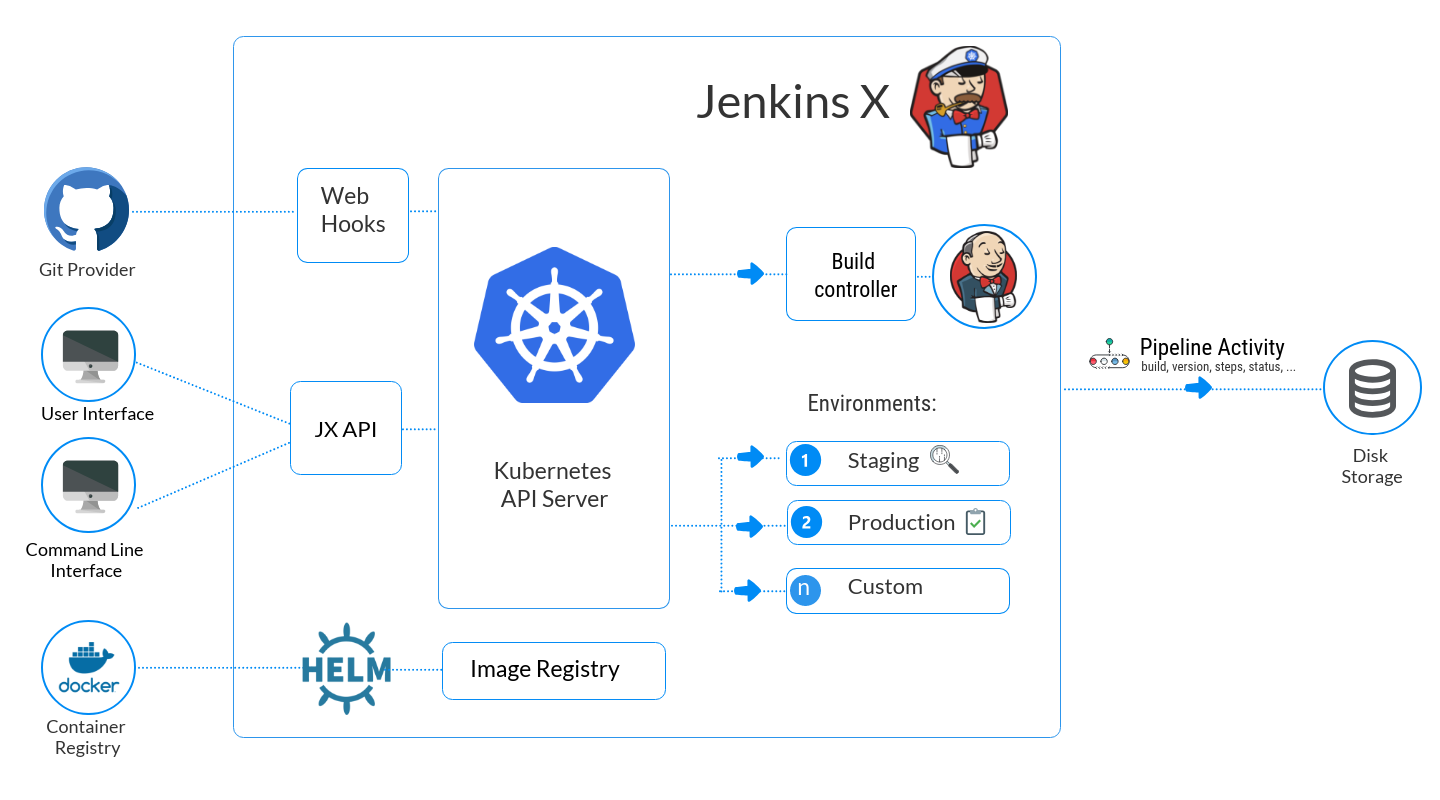
Traditional CI/CD pipeline like classic Jenkins they require heavy customization, and not cloud-native.
Jenkins X is opinionated and cloud-native CI/CD pipeline built on top of Kubernetes. Jenkins X uses Tekton (a Kubernetes-native pipeline engine) to do the job.
## init the environment, configuration and link to the target gcloud project gcloud init ## we need kubectl to interact with K8s cluster gcloud components install kubectl
Then create main.tf file to provision jenkins X cluster on GCP, go to https://registry.terraform.io/ and search jx.
1
Create First App on Jenkins X Pipeline
Key components:
Applciation code source
Docker file: All services store in docker image
Helm chart: All docker images wrapped in helm packages
Jenkins X file: Defines the build pipeline
1
jx create quickstart
JX commands recap:
1 2 3 4 5 6 7 8 9 10
## out of box workflow for many language projects jx create qucikstart ## import an existing project to jx jx import
## watch pipeline for a project jx get activity -f <project name> -w
## view logs for a build pipeline jx get build logs <project name>
Orchestrates Jenkins X pipelines via GitHub events
Automates interactions with pull requests Enables
ChatOps driven development
GitHub only, to be superseded by Lighthouse
Github webhook will call Prow, the webhook is actuall a HTTP POST request that contains the event payload, then Prow will execute pipeline. Conversely, Prow can call Github API.
So bascially, we use quickstart to create a vanilla project skeleton, then Jenkins X-ify this project by build packs (generate languange specific Jenkins X template files). So jx import existing project also use build packs to do the job.
1 2 3 4 5 6 7 8 9 10 11
## list repositories containing quickstarts jx get quickstartlocation
## create new quickstart repository jx create quickstartlocation
## delete new quickstart repository jx delete quickstartlocation
## edit current buildpack location jx edit buildpack
Customize Jenkins X Pipeline
Jenkins X file definition has YAML file structure, make use of inheritance to reduce repetition.
Vault vs K8s secrets?
Examples of what Vault can do that k8s secrets cannot:
With Vault you can rotate secrets and have secrets with short TTL
With Vault you can access secrets across namespaces (or outside the k8s cluster)
Vault can provide a PKI for signing certs (enabling for example automation of cert generation for mtls)
Vault can use LDAP, oauth, IAM, etc as identity providers
Secure, store and tightly control access to tokens, passwords, certificates, encryption keys for protecting secrets and other sensitive data using a UI, CLI, or HTTP API.
注意API的path,并不是和UI上的path一样!
Vault works well with Consul, for example, set Consul as storage backend.
Start a Vault server:
1 2 3
## same as consul in development mode, don't use this in production! ## 0.0.0.0:8200, used for vagrant port fordwarding access from host vault server -dev-listen-address 0.0.0.0:8200 -dev
Output as below:
1 2 3 4 5 6 7 8 9 10 11 12 13 14 15 16
WARNING! dev mode is enabled! In this mode, Vault runs entirely in-memory and starts unsealed with a single unseal key. The root token is already authenticated to the CLI, so you can immediately begin using Vault.
You may need to set the following environment variable:
$ export VAULT_ADDR='http://0.0.0.0:8200'
The unseal key and root token are displayed below in case you want to seal/unseal the Vault or re-authenticate.
## these two are critical Unseal Key: pLNBmZQRHvspdy5unZcTjm1jOVQ81Z0pO6ywYHNP1zQ= Root Token: s.hfnmMkgG7cggWDOmPfHC1jIe
Development mode should NOT be used in production installations!
unseal key在production mode中用来解除对Vault server的封锁,否则无法login as root.
## Vault API access export VAULT_ADDR='http://0.0.0.0:8200' export VAULT_TOKEN=s.ttlDcetbJe3uLt0FF5rSidg3
## login to vault server need VAULT_TOKEN to login vault login
Vault web UI access: http://localhost:8200
So, just like Consul, there are 3 ways to interact with Vault server: UI, API, CLI (actually running API under the hood).
secret is a pre-existing secret engine folder in Vault storage path, you can see it in UI:
1 2 3 4 5 6
#Write a secret vault kv put secret/hg2g answer=42 #For Linux # marvin.json is a json file curl --header "X-Vault-Token: $VAULT_TOKEN" --request POST \ --data @marvin.json $VAULT_ADDR/v1/secret/data/marvin
#Get a secret vault kv get secret/hg2g #specify format vault kv get -format=json secret/hg2g vault kv get -format=yaml secret/hg2g #For Linux #Install jq if necessary sudo yum install jq -y curl --header "X-Vault-Token: $VAULT_TOKEN"$VAULT_ADDR/v1/secret/data/marvin | jq
#Put a new secret in and a new value for an existing secret vault kv put secret/hg2g answer=54 ford=prefect vault kv get secret/hg2g
#Delete the secrets vault kv delete secret/hg2g vault kv get secret/hg2g
#For Linux curl --header "X-Vault-Token: $VAULT_TOKEN" --request DELETE $VAULT_ADDR/v1/secret/data/marvin
Working with Secrets
Secret lifecycle:
Create
Read
Update
Delete (soft or hard unrecoverable)
Destroy
There is version 1 and version 2 of secret engine server, version 2 is more recoverable and versioning but less performance then version 1 if you need to scale. secret folder 就是默认创建的secret engine, version 2, 可以去UI 查看configuration.
Everytime you update the key, the version increment by 1:
1 2 3 4
## pick value by version vault kv get -version=3 secret/hg2g ## from API curl -X GET --header "X-Vault-Token: $VAULT_TOKEN"$VAULT_ADDR/v1/secret/data/hg2g?version=3 | jq .data.data
If you delete version 3, you still can get version 1 or 2:
1 2 3 4 5 6 7 8 9 10
vault kv delete secret/hg2g vault kv get -version=2 secret/hg2g ## undelete version 3 ## -versions not -version, you can undelete multiple: -versions=2,3 vault kv undelete -versions=3 secret/hg2g
## API #For Linux curl --header "X-Vault-Token: $VAULT_TOKEN" --request POST \ $VAULT_ADDR/v1/secret/undelete/hg2g --data '{"versions": [2]}'
Destroy, can no longer undelete:
1 2 3 4 5 6 7 8 9 10 11 12 13 14 15
#Destroy the secrets vault kv destroy -versions=1,2 secret/hg2g
#For Linux ## metadata is still there curl --header "X-Vault-Token: $VAULT_TOKEN" --request POST \ $VAULT_ADDR/v1/secret/destroy/hg2g --data '{"versions": [1,2]}'
#Remove all data about secrets vault kv metadata delete secret/hg2g vault kv get secret/hg2g
#For Linux curl --header "X-Vault-Token: $VAULT_TOKEN" --request DELETE \ $VAULT_ADDR/v1/secret/metadata/hg2g
Vault在这里类似一个中间层,在user 和 Mysql instance之间,保存和传递credential和请求. 这个demo在AZure上spin up了一个bitnami Mysql instance,和本地的vault mysql secret engine关联,然后通过Vault联系Mysql 产生一个dynamic user,并授予这个临时user权限,我们通过这个临时user就可以操作Mysql 数据库了。
Besides Mysql example, Vault secrets can be used for certificates, for SSH credentials, etc.
Secrets engine make Vault extensible, there are different plugin to handle different needs.
Controlling Access
Similar to RBAC in K8s, authentication method to control login, policies to control what is able to do, managing client tokens.
## list current auth methods ## by default, we only have token auth method vault auth list ## enable new auth method vault auth enable userpass ## create user vault write auth/userpass/users/arthur password=dent ## list user vault list auth/userpass/users
You will see the changes in UI Access section.
Once you create a user/password, then you can run for example:
## 这里使用的是user/password login,不是用token vault login -method=userpass username=arthur ## then input password Password (will be hidden): ## 这个warning是因为,做实验的时候之前export了root token WARNING! The VAULT_TOKEN environment variable is set! This takes precedence over the value set by this command. To use the value set by this command, unset the VAULT_TOKEN environment variable or set it to the token displayed below.
Success! You are now authenticated. The token information displayed below is already stored in the token helper. You do NOT need to run "vault login" again. Future Vault requests will automatically use this token.
Key Value --- ----- token s.z52FGzn78XynKlxeS0Akt0t7 token_accessor 90LaRNNtsCUEg6yDd9ldRi3v token_duration 768h token_renewable true token_policies ["default"] identity_policies [] policies ["default"] token_meta_username arthur
## will show you where is the token from, not root token any more ## see `path` field where is the token from vault token lookup
Token represents who you are and what you can do, for example, the user itself cannot update its password via its token:
1 2 3 4 5 6 7 8 9 10
## update password vault write auth/userpass/users/arthur/password password=tricia ## output Error writing data to auth/userpass/users/arthur/password: Error making API request.
URL: PUT http://0.0.0.0:8200/v1/auth/userpass/users/arthur/password Code: 403. Errors:
LDAP (Lightweight Directory Access Protocol) is an application protocol for querying and modifying items in directory service providers like Active Directory, which supports a form of LDAP.
Short answer: AD is a directory services database, and LDAP is one of the protocols you can use to talk to it.
见下面vault policy章节的例子.
Case: 在外部设置了AD as authentication method, enable LDAP auth in Vault. Then user login Vault with AD credentials against LDAP talk to AD, AD talk to Vault and determine the policy about what the user can do, then user will get the right token from vault to access the store.
这个例子,远程登录了一个Vault server, login as root, create devkv store with key and value pair, then create policy dev with HCL file for user to access the devkv.
Enable LDAP auth, configure it with Active Directory remotely. Then assign the developers group in LDAP with dev policy.
Then user adent login vault against ldap method. The user is in the developers group so it will get token with permission specified by dev policy.
These services need to be discovered by each other. 对于越来越复杂的内部组织结构,比如很多internal load balancer, Consul can come and play, 比如提供内部的DNS服务, Service discovery.
Failure Dectection, Consul running lightweight Consul agent (server or client mode) on each of node in your environment. The agent will diagnose all services running locally.
Reacting configuration via key/value store, reflecting changes quickly in near real time.
Multi-Data center aware.
Consul vs Other softwares, see here.
Especailly Consul vs Istio, see here.
在这一章的例子中提供了一个很好的建模思路!在vagrant virutal machine中安装docker,然后用container的方式运行一些服务(比如这里的Nginx web and HAProxy LB),再expose(localhost)这些端口(对machine iptables做了更改),这样就避免了很多的virtual machine上的安装配置工作。
==> Log data will now stream in as it occurs: ... ==> Consul agent running! ... 2020-06-20T03:38:12.476Z [INFO] agent: (LAN) joining: lan_addresses=[172.20.20.31] 2020-06-20T03:38:12.477Z [WARN] agent.client.manager: No servers available 2020-06-20T03:38:12.477Z [ERROR] agent.anti_entropy: failed to sync remote state: error="No known Consul servers" 2020-06-20T03:38:12.480Z [INFO] agent.client.serf.lan: serf: EventMemberJoin: consul-server 172.20.20.31 2020-06-20T03:38:12.480Z [INFO] agent: (LAN) joined: number_of_nodes=1 ...
虽然通过的ui virtual machine暴露的web,但是所有信息都来自consul server! 和k8s nodeport的模式类似。
Can access via HTTP API: https://www.consul.io/api-docs
1 2 3
http://localhost:8500/v1/catalog/nodes # format readable http://localhost:8500/v1/catalog/nodes?pretty
DNS query, go to ui node, when we run consul agent, the DNS port is 8600:
1 2 3 4 5 6
# query node dig @localhost -p 8600 consul-server.node.consul # query service dig @localhost -p 8600 consul.service.consul # query service record, will show you the server port, such as 8300 dig @localhost -p 8600 consul.service.consul SRV
The RPC Protocol is deprecated and support was removed in Consul 0.8. Please use the HTTP API, which has support for all features of the RPC Protocol.
Consul Commands
这里提到了2个有用的commands, 本来是用RPC实现的,但现在改了:
1 2 3 4 5
# can specify target point # provide debug info consul info [-http-addr=172.20.20.31:8500] # get log message, 这样就可以在某一agent上查看任意其他的agent log了 consul monitor [-http-addr=172.20.20.31:8500]
Here 172.20.20.31 is consul server, you must start it by -client 0.0.0.0, otherwise the port is bound with loopback interface and cannot access.
Other commands:
1 2 3 4 5 6 7 8 9 10 11 12 13 14 15 16
# maintain node # enable maintaince, service will not show in consul DNS # -service: maintain for a specific service consul maint -enable -reason "Because..." consul maint consul maint -disable
# validate config file # the config file must complete! cannot separate to several parts! consul validate [config file]
BTY, gracefully exit the consul process will not cause warning or error in UI display. If you force kill it, the node will be marked as critical.
Service Discovery
One way to register service to consul is use Service definition:https://www.consul.io/docs/agent/services
比如register LB service to consul,这样的好处就是前面提到了,consul会根据其他agent反馈的web nginx的情况及时修改HAProxy的config信息,更新配置, 接下来会看到:
Regsiter service does not mean the service is healthy, also need to do healthy check:
For example:
Then launch consul client agent, add one more service config file web.service.json for registration, for example, in web1 node:
1 2 3
consul agent -config-file /vagrant/common.json \ -advertise 172.20.20.21 \ -config-file /vagrant/web.service.json
Then check the consul UI, you will see the node is good but service is unhealthy because now there is no nginx running, so create nginx in web1 node:
1
/vagrant/setup.web.sh
Then refresh the web page, everything is good.
You can dig the web service from ui node, this is so called internalservice discovery, not facing public. 这些数据对于LB来说可以用来direct traffic, 这就是Consul自带DNS的好处,没有什么额外的设置了,并且还提供了health check,就非常方便了. 并且public facing LB也在Consul中注册了,这样一旦LB goes down,就能被马上监测到。
1 2
dig @localhost -p 8600 web.service.consul SRV # you will see exactly the number of web service running
Except query DNS from dig, consul HTTP API also can do it:
1 2 3 4 5 6 7
# services list curl http://localhost:8500/v1/catalog/services?pretty # service web detail curl http://localhost:8500/v1/catalog/service/web?pretty # health check # see the Status field: passing or critical curl http://localhost:8500/v1/health/service/web?pretty
listen http-in bind *:80 server web1 172.20.20.21:8080 server web2 172.20.20.22:8080
8080 port is where nginx web service from, bind *:80 is meant to expose port for health check, 意思是外界通过LB上的80 端口访问后台web servers, 这也就是为啥consul中LB的health check输出 居然是welcome to Nginx!,因为那是后台返回的页面.
In the demo, we run HAProxy container in lb machine. How to verify it is up and running?
In any machine:
1 2
dig @localhost -p 8600 lb.service.consul SRV # the lb record will show
Now let’s verify LB is actually working:
1 2 3
# try several times, LB will cycling through backend servers # you will see different ip returned curl http://localhost/ip.html
如果这时关掉一个web server,在HAProxy没有enable health check功能的情况下,仍然会把请求发往已经挂掉的server,则用户得到503 error. 这也是很多LB的问题,需要设置自身的health check。但如果用consul的DNS,由于各个server的health check已经集成进去了,consul会返回健康的server进行服务. So we can feed information to LB from consul dynamically.
Workflow:
consul template will listen changes from consul, as changes occur it will be pushed to the consul template daemon (run in lb machine). consul template daemon will generate HAProxy new config file from a template for HAProxy, then we tell docker to restart HAProxy (or HAProxy reload config).
Open the consul UI, in terminal go to web1 or web2 machine, stop/start the docker, see the updates. Also in lb machine, run below command to see the LB still works good, it will not return the unhealthy server to you:
1
curl http://localhost/ip.html
Other tools
Envconsul
Envconsul provides a convenient way to launch a subprocess with environment variables populated from HashiCorp Consul and Vault.
前面提到了config file for process, here Envconsul set env variables for process and kick off for us.
confd
confd is a lightweight configuration management tool
fabio
fabio is a fast, modern, zero-conf load balancing HTTP(S) and TCP router for deploying applications managed by consul
Reactive Configuration
One of primary use case is to update app configuration. for example, when services changes inject the changes to consul key/value pairs and have it pushed into our application.
注意key/value不要用来当Database, it’s not intended for! 但是运作的方式几乎和etcd一样!
https://etcd.io/
Go to Consul UI to add key/value pairs, create a folder path /prod/portal/haproxy, then create key/value pair in it:
# list all pairs curl http://localhost:8500/v1/kv/?recurse'&'pretty
# add key/value via HTTP API # /prod/portal/haproxy is path we created before curl -X PUT -d '50s' http://localhost:8500/v1/kv/prod/portal/haproxy/timeout-server # delete curl -X DELETE http://localhost:8500/v1/kv/prod/portal/haproxy/timeout-server # get one curl -X GET http://localhost:8500/v1/kv/prod/portal/haproxy/timeout-server?pretty curl -X GET http://localhost:8500/v1/kv/prod/portal/haproxy/timeout-server?raw
The API will return JSON data, you can use jq to parse it.
Update the LB config template haproxy.ctmpl as:
1 2 3 4 5 6 7 8 9 10 11 12 13 14 15 16
global maxconn {{key "prod/portal/haproxy/maxconn"}}
listen http-in bind *:80{{range service "web"}} server {{.Node}} {{.Address}}:{{.Port}}{{end}}
stats {{key "prod/portal/haproxy/stats"}} stats uri /haproxy stats refresh 5s
Then make consul-template process reload without killing it:
1 2
# HUP signal will make consul-tempalte reload killall -HUP consul-template
Then you will see the haproxy.cfg file is regenerated!
来谈谈为什么这个key/value setting如此重要:
有时候实现并不知道具体设置参数,在production环境,你可能想real time更新参数,比如这里LB中maxconn,实际使用中可能由于machine CPU, memory等因素,不得不调小,你可以用consul maint或其他方式去调节, but that would be a pain and the change will take time to converge across the infrastructure.
Use Key/Value store is really a reactive confiuration!
A blocking query is used to wait for a potential change using long polling. Not all endpoints support blocking, but each endpoint uniquely documents its support for blocking queries in the documentation.
Endpoints that support blocking queries return an HTTP header named X-Consul-Index. This is a unique identifier representing the current state of the requested resource.
Use curl -v to check HEADER info to see if it has X-Consul-Index.
这个功能可以用在比如自己的app long polling consul API, 去等待changes happen, reactive listen to changes of consul. 这比周期性的探测节省很多资源。for example:
1
curl -v http://localhost:8500/v1/kv/prod/portal/haproxy/stats?index=<X-Consul-Index value in header>'&'wait=40s
如果有change发生,每次X-Consul-Index value 都会变化.
Health Check
Gossip pool via Serf and Edge triggered updates, peer to peer.
Serf: https://www.serfdom.io/ (在UI中每个node都有Serf health status)
If you kill and start the consul agent in one node, you will see the log something like:
Membership (discovery, joining) - joining the cluster entails only knowing the address of one other node (not required to be a server)
Failure detection - affords distributed health checks, no need for centralized health checking
Event broadcast - i.e. leader elected, custom events
System-Level Check
非常类似于K8s的 liveness probe.
https://www.consul.io/docs/agent/checks.html
One of the primary roles of the agent is management of system-level and application-level health checks. A health check is considered to be application-level if it is associated with a service. If not associated with a service, the check monitors the health of the entire node.
前面都是用到了service check, 这里增加check node status. For example, disk usage, memory usage, etc.
Update common.json config file, this config file will take effect on lb and web machines, 这部分配置在最近的新版本已经变化了:
echo"RAM: ${RAM_UTILIZATION}%, ${AVAILABLE_RAM} available of ${TOTAL_RAM} total "
if (( $RAM_UTILIZATION > 95 )); then exit 2 fi
if (( $RAM_UTILIZATION > 70 )); then exit 1 fi
exit 0
The system-level health check sections will be displayed in consul UI.
For stress test, install stress software in web1 machine (in the demo code it is added):
1 2
# install sudo apt-get install stress
CPU stress test, then you will see in the consul UI the node is unhealthy and is cycled out from LB:
1
stress -c 1
Watching the consul UI for web1, you will see CPU check failed:
Recently I am working on Kubernetes Operator, using golang to implement the logic for operators, after having a brief understanding of Go value and Philosophy, and basic syntax, structure, this book is my next step.
There are additional, comprehensive resources on Go web site:
https://go.dev/
env contains all environment variables, for example: env.BUILD_NUMBER
Jenkins pipeline automatically creates a global variable for each environment variable
params contains all build parameters, for example: params.WKC_BUILD_NUMBER
Jenkins also automatically creates an environment variable for each build parameter (and as a consequence of second point a global variable).
Environment variables can be overridden or unset (via Groovy script block) but params is an immutable Map and cannot be changed. Best practice is to always use params when you need to get a build parameter.
这些信息哪里来的呢?在配置pipeline时,查看pipeline syntax -> Global Variables Reference.
Operators grew out of work at CoreOS during 2015 and 2016. User experience with the Operators built there and continuing at Red Hat.
An Operator continues to monitor its application as it runs, and can back up data, recover from failures, and upgrade the application over time, automatically.
An Operator is a custom Kubernetes controller watching a CR type and taking application-specific actions to make reality match the spec in that resource.
Making an Operator means creating a CRD and providing a program that runs in a loop watching CRs of that kind.
The Operator pattern arose in response to infrastructure engineers and developers wanting to extend Kubernetes to provide features specific to their sites and software.
you’ll deploy the etcd Operator, then have it create an etcd cluster according to your specifications. You will have the Operator recover from failures and perform a version upgrade while the etcd API continues to service read and write requests, showing how an Operator automates the lifecycle of a piece of foundation software.
A CRD is akin to a schema for a CR, defining the CR’s fields and the types of values those fields contain:
The CR’s group, version, and kind together form the fully qualified name of a Kubernetes resource type. That canonical name must be unique across a cluster.
After create CR resource, operator will generate 3 replicas pod (the pod definition is written by operator logic).
This example etcd cluster is a first-class citizen, an EtcdCluster in your cluster’s API. Since it’s an API resource, you can get the etcd cluster spec and status directly from Kubernetes.
1 2
## etcdcluster is a resource just like pod/deploy/sts kubectl describe etcdcluster example-etcd-cluster
The etcd Operator creates a Kubernetes service in the etcd cluster’s namespace:
1
kubectl get services --selector etcd_cluster=example-etcd-cluster
Run the etcd client on the cluster and use it to connect to the client service and interact with the etcd API.
From the etcd container’s shell, create and read a key-value pair in etcd with etcdctl’s put and get verbs:
1 2 3 4 5 6 7
export ETCDCTL_API=3 export ETCDCSVC=http://example-etcd-cluster-client:2379 etcdctl --endpoints $ETCDCSVC put foo bar etcdctl --endpoints $ETCDCSVC get foo
## check etcd cluster general health etcdctl --endpoints http://example-etcd-cluster-client:2379 cluster-health
You can try to delete etcd pod or upgrade the version (edit cr file then apply) and watching the operator recover the health.
Operators extend two key Kubernetes concepts: resources and controllers. The Kubernetes API includes a mechanism, the CRD, for defining new resources.
这2段话把一般通用控制器和operator的区别讲清楚了:
The actions the ReplicaSet controller takes are intentionally general and application agnostic. It does not, should not, and truly cannot know the particulars of startup and shutdown sequences for every application that might run on a Kubernetes cluster.
An Operator is the application-specific combination of CRs and a custom controller that does know all the details about starting, scaling, recovering, and managing its application.
Every Operator has one or more custom controllers implementing its application-specific management logic.
An Operator, in turn, can be limited to a namespace, or it can maintain its operand across an entire cluster.
A service account is a special type of cluster user for authorizing programs instead of people. An Operator is a program that uses the Kubernetes API, and most Operators should derive their access rights from a service account.
Chapter 4 The Operator Framework
This chapter introduced the three pillars of the Operator Framework: the Operator SDK for building and developing Operators; Operator Lifecycle Manager for distributing, installing, and upgrading them; and Operator Metering for measuring Operator performance and resource consumption.
The Red Hat Operator Framework makes it simpler to create and distribute Operators. It makes building Operators easier with a software development kit (SDK) that automates much of the repetitive implementation work. The Framework also provides mechanisms for deploying and managing Operators. Operator Lifecycle Manager (OLM) is an Operator that installs, manages, and upgrades other Operators. Operator Metering is a metrics system that accounts for Operators’ use of cluster resources.
Operator SDK: https://github.com/operator-framework/operator-sdk
The SDK currently includes first-class support for constructing Operators in the Go programming language, with support for other languages planned. The SDK also offers what might be described as an adapter architecture for Helm charts or Ansible playbooks.
Operator Lifecycle Manager takes the Operator pattern one level up the stack: it’s an Operator that acquires, deploys, and manages Operators on a Kubernetes cluster.
Operator Metering is a system for analyzing the resource usage of the Operators running on Kubernetes clusters.
Install operator SDK: https://sdk.operatorframework.io/docs/install-operator-sdk/
注意k8s version是否与当前operator sdk兼容,比如我实验的时候k8s version 1.13.2,它支持的crd api version is apiextensions.k8s.io/v1beta1, 而最近的operator sdk生成的crd api version is apiextensions.k8s.io/v1. 书中用的operator sdk version 0.11.0.
Chapter 5 Sample Application: Visitors Site
In the chapters that follow, we’ll create Operators to deploy this application using each of the approaches provided by the Operator SDK (Helm, Ansible, and Go), and explore the benefits and drawbacks of each.
读到这里,疑惑Helm是如何处理这个问题的,特别是对同一个charts之中的依赖:
When deploying applications through manifests, awareness of these relationships is required to ensure that the values line up.
You would have to create CRDs to specify the interface for end users.
Kubernetes controllers would not only need to be written with the Operator’s domain-specific logic, but also be correctly hooked into a running cluster to receive the proper notifications. Roles and service accounts would need to be created to permit the Operator to function in the capacity it needs. An Operator is run as a pod inside of a cluster, so an image would need to be built, along with its accompanying deployment manifest.
这章节主要是利用已有的Helm or Ansibel去构造Adapter Operator:
The Operator SDK provides a solution to both these problems through its Adapter Operators. Through the command-line tool, the SDK generates the code necessary to run technologies such as Helm and Ansible in an Operator.
First understand the role of CRDs.
A CRD is the specification of what constitutes a CR. In particular, the CRD defines the allowed configuration values and the expected output that describes the current state of the resource.
A CRD is created when a new Operator project is generated by the SDK.
The SDK prompts the user for two pieces of information about the CRD during project creation: kind, api-version
A Helm Operator can deploy each instance of an application with a different version of values.yaml. The Operator SDK generates Kubernetes controller code for a Helm Operator when it is passed the --type=helm argument.
As a prerequisite, be sure to install the Helm command-line tools on your machine.
New Chart
Generate a blank helm chart structure within the operator project code:
1 2 3
OPERATOR_NAME=visitors-helm-operator operator-sdk new $OPERATOR_NAME --api-version=example.com/v1 --kind=VisitorsApp --type=helm
At this point, everything is in place to begin to implement your chart.
There are several direcotyies created:
build: it contains Dockerfile for operator image
deploy: crds definition, role and rolebinding, service account
helm-charts: helm chart structure for your app
watches.yaml: maps each CR type to the specific Helm chart that is used to handle it.
More or less the same as Helm operator generation.
Generate blank Ansible operator project:
1 2
OPERATOR_NAME=visitors-ansible-operator operator-sdk new $OPERATOR_NAME --api-version=example.com/v1 --kind=VisitorsApp --type=ansible
Test Operator
An Operator is delivered as a normal container image. However, during the development and testing cycle, it is often easier to skip the image creation process and simply run the Operator outside of the cluster.
这个用在开发测试的时候,它不会部署一个真正的operator deployment,只是一个process,但实验效果和真实的一样。这里只是针对helm and ansible的类型.
1 2 3 4 5 6
## go to root path of operator project ## set full path in `chart` field to chart cp watches.yaml local-watches.yaml kubectl apply -f deploy/crds/*_crd.yaml ## start opeerator process operator-sdk up local --watches-file ./local-watches.yaml
The process is up and running, next is to apply your cr yaml:
你会看到log的变化,以及application在k8s cluster中的更新。
Once the test is complete, end the running process by pressing Ctrl-C.
During development, repeat this process to test changes. On each iteration, be sure to restart the Operator process to pick up any changes to the Helm or Ansible files
Deploy Operator
Running an Operator outside of the cluster, is convenient for testing and debugging purposes, but production Operators run as Kubernetes deployments.
Build the operator image. The Operator SDK’s build command chains to the underlying Docker daemon to build the Operator image, and takes the full image name and version when run:
1
operator-sdk build jdob/visitors-operator:0.1
You can check the Dockerfile, no additional changes are needed. the ${HOME} is consistent with the path in watches.yaml.
Once built, push the image to an externally accessible repository
Configure the deployment. Update the deploy/operator.yaml file that the SDK generates with the name of the image.
The Operator SDK provides that flexibility by making it easy for developers to use the Go programming language, including its ecosystem of external libraries, in their Operators. Write acutall business logic of operator.
While you can write all these pieces manually, the Operator SDK provides commands that will automate the creation of much of the supporting code, allowing you to focus on implementing the actual business logic of the Operator.
We will explore the files that need to be edited with custom application logic and discuss some common practices for Operator development.
OPERATOR_NAME=visitors-operator ## 这个路径和后面的controller import中的路径要一致! OPERATOR_PATH=$GOPATH/src/github.com/jdob mkdir -p $OPERATOR_PATH cd$OPERATOR_PATH ## no --type specified, default is go operator-sdk new $OPERATOR_NAME
The generation can take a few minutes as all of the Go dependencies are downloaded.
Add CRDs
You can add new CRDs to an Operator using the SDK’s add api command. Run from the Operator project root directory to generate CRD: 这应该说明一个Operator可以有多个CRDs.
1 2 3
cd$OPERATOR_PATH/$OPERATOR_NAME operator-sdk add api --api-version=example.com/v1 --kind=VisitorsApp ## from command outputs, you will see what files are generated
3 files are important:
deploy/crds/*cr.yaml
deploy/crds/*crd.yaml
pkg/apis/example/v1/visitorsapp_types.go: contains a number of struct objects that the Operator codebase leverages
For example, in pkg/apis/example/v1/visitorsapp_types.go edit the Spec and Status struct:
// VisitorsAppSpec defines the desired state of VisitorsApp // +k8s:openapi-gen=true type VisitorsAppSpec struct { // INSERT ADDITIONAL SPEC FIELDS - desired state of cluster // Important: Run "operator-sdk generate k8s" to regenerate code after modifying this file // Add custom validation using kubebuilder tags: https://book.kubebuilder.io/beyond_basics/generating_crd.html
Size int32`json:"size"` Title string`json:"title"` }
// VisitorsAppStatus defines the observed state of VisitorsApp // +k8s:openapi-gen=true type VisitorsAppStatus struct { // INSERT ADDITIONAL STATUS FIELD - define observed state of cluster // Important: Run "operator-sdk generate k8s" to regenerate code after modifying this file // Add custom validation using kubebuilder tags: https://book.kubebuilder.io/beyond_basics/generating_crd.html
Inside of the Operator pod itself, you need a controller to watch for changes to CRs and react accordingly. Similar to adding a CRD, you use the SDK to generate the controller’s skeleton code.
The first watch listens for changes to the primary resource that the controller monitors. 也就是自定义的kind类型。
The second watch, or more accurately, series of watches, listens for changes to any child resources the Operator created to support the primary resource. 也就是自定义kind类型中间接的其他resources,比如deployment, sts, service等
Since Go-based Operators make heavy use of the Go Kubernetes libraries, it may be useful to review:
https://pkg.go.dev/k8s.io/api
the core/v1 and apps/v1 modules are frequently used to interact with the common Kubernetes resources.
这里提到了update status value,应该对应的是resource yaml中底部的status 信息:
关于Child resource deletion:
If the child resource’s owner type is correctly set to the primary resource, when the parent is deleted, Kubernetes garbage collection will automatically clean up all of its child resources
It is important to understand that when Kubernetes deletes a resource, it still calls the Reconcile function.
There are times, however, where specific cleanup logic is required. The approach in such instances is to block the deletion of the primary resource through the use of a finalizer. A finalizer is simply a series of strings on a resource, 感觉就是一个mark.
1
2
3
4
5
6
7
8
9
10
11
12
13
14
15
16
17
18
19
finalizer := "visitors.example.com"
beingDeleted := instance.GetDeletionTimestamp() != nil if beingDeleted { if contains(instance.GetFinalizers(), finalizer) {
// Perform finalization logic. If this fails, leave the finalizer // intact and requeue the reconcile request to attempt the clean // up again without allowing Kubernetes to actually delete // the resource.
It is critical that Operators are idempotent. Multiple calls to reconcile an unchanged resource must produce the same effect each time.
Before creating child resources, check to see if they already exist. Remember, Kubernetes may call the reconcile loop for a variety of reasons beyond when a user first creates a CR. Your controller should not duplicate the CR’s children on each iteration through the loop.
Changes to a resource’s spec (in other words, its configuration values) trigger the reconcile loop. Therefore, it is often not enough to simply check for the existence of expected child resources. The Operator also needs to verify that the child resource configuration matches what is defined in the parent resource at the time of reconciliation.
Reconciliation is not necessarily called for each change to the resource. It is possible that a single reconciliation may contain multiple changes. The Operator must be careful to ensure the entire state of the CR is represented by all of its child resources.
Just because an Operator does not need to make changes during a reconciliation request doesn’t mean it doesn’t need to update the CR’s Status field. Depending on what values are captured in the CR’s status, it may make sense to update these even if the Operator determines it doesn’t need to make any changes to the existing resources.
Operator Impact
If the Operator incorrectly handles operations, they can negatively affect the performance of the entire cluster.
Test Operator
如果operator test有错误,则image build之后运行也会出现同样的错误!
The process running the Operator may be outside of the cluster, but Kubernetes will treat it as it does any other controller.
Go to the root project directory:
1 2 3 4 5 6
## deploy CRD kubectl apply -f deploy/crds/*_crd.yaml ## start operator in local mode operator-sdk up local --namespace default ## deploy CR kubectl apply -f deploy/crds/*_cr.yaml
The Operator SDK uses credentials from the kubectl configuration file to connect to the cluster and attach the Operator. The running process acts as if it were an Operator pod running inside of the cluster and writes logging information to standard output.
Once you have written an Operator, it’s time to turn your attention to its installation and management. As there are multiple steps involved in deploying an Operator, a management layer becomes necessary to facilitate the process. 就是管理Operator的东西.
OLM’s benefits extend beyond installation into Day 2 operations, including managing upgrades to existing Operators, providing a means to convey Operator stability through version channels, and the ability to aggregate multiple Operator hosting sources into a single interface. OLM在Openshift 上是自带的,K8s上没有。OLM也是通过CRD实现的,在Openshift 中run oc get crd 就可以看到相关CRDs.
ClusterServiceVersion
You can think of a CSV as analogous to a Linux package, such as a Red Hat Package Manager (RPM) file.
Much like how a deployment describes the “pod template” for the pods it creates, a CSV contains a “deployment template” for the deployment of the Operator pod.
CatalogSource
A CatalogSource contains information for accessing a repository of Operators. OLM provides a utility API named packagemanifests for querying catalog sources, which provides a list of Operators and the catalogs in which they are found.
1
kubectl -n olm get packagemanifests
Subscription
End users create a subscription to install, and subsequently update, the Operators that OLM provides. A subscription is made to a channel, which is a stream of Operator versions, such as “stable” or “nightly.”
To continue with the earlier analogy to Linux packages, a subscription is equivalent to a command that installs a package, such as yum install.
InstallPlan
A subscription creates an InstallPlan, which describes the full list of resources that OLM will create to satisfy the CSV’s resource requirements.
OperatorGroup
An Operator belonging to an OperatorGroup will not react to custom resource changes in a namespace not indicated by the group.
After applying, The CRDs for OLM are created, the olm pods are up and running in olm namespace. OLM可以用于和OperatorHub.io 进行交互,如同Helm 和HelmHub, Docker 和DockerHub. 书中用了个例子说明如何部署etcd operator from operatorHub.
后面主要是讲如何publish自己的operator了, 目前用不到。
Chapter 9 Operator Philosophy
Let’s try to connect those tactics to the strategic ideas that underpin them to understand an existential question: what are Operators for?
An Operator reduces human intervention bugs by automating the regular chores that keep its application running. Operators: Kubernetes Application Reliability Engineering
有些启发价值:
You can build Operators that not only run and upgrade an application, but respond to errors or slowing performance.
Control loops in Kubernetes watch resources and react when they don’t match some desired state. Operators let you customize a control loop for resources that represent your application. The first Operator concerns are usually automatic deployment and self-service provisioning of the operand. Beyond that first level of the maturity model, an Operator should know its application’s critical state and how to repair it. The Operator can then be extended to observe key application metrics and act to tune, repair, or report on them.
Site Reliability Engineering lists the four golden signals as latency, traffic, errors, and saturation.
Highly Successful Operators:
An Operator should run as a single Kubernetes deployment.
Operators should define new custom resource types on the cluster.
Operators should use appropriate Kubernetes abstractions whenever possible.
Operator termination should not affect the operand.
Operator termination should not affect the operand.
Operator termination should not affect the operand.
Operators should be thoroughly tested, including chaos testing.
Appendix
Running an Operator as a Deployment Inside a Cluster
Please see my git repo for more details.
1 2 3
## build operator image ## go to project root directory operator-sdk build image:tag
Then docker push image to docker registry, replace the image placeholder in operator.yaml file. Then apply the CR yaml.
书中另外2个appendix 是关于CRD validation and RBAC control的设置。